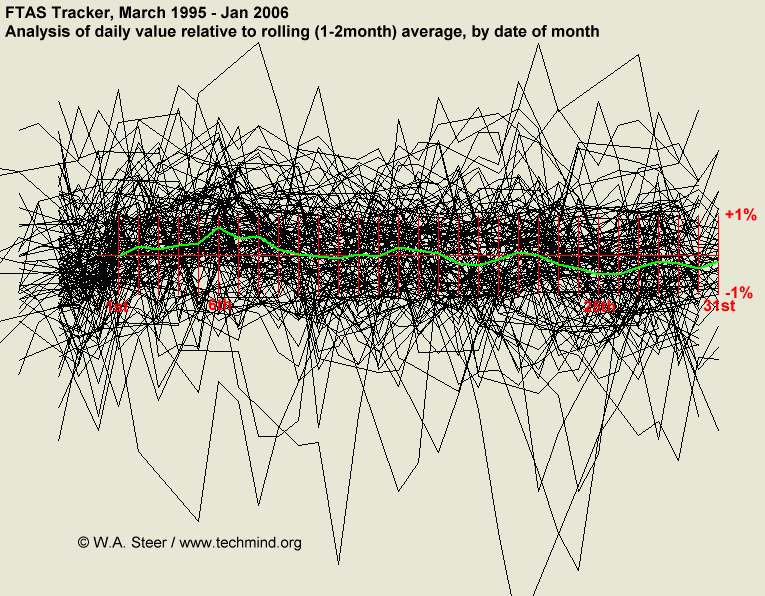
Index value plot:
An index value plot, plots distances against the corresponding observation number in the dataset. In many cases, the row number corresponds to the order in which the data were collected. If this is the case, this would be similar to plotting the residuals against time. The index plot is a helpful diagnostic test for normal linear and particularly generalized linear models. Both outliers and influential points can be detected by the index plot. It is particularly useful when the data is in time order so that pattern in the residuals, over time can be detected. If a residual index plot is showing a trend in time, then they are not independent.
No comments:
Post a Comment