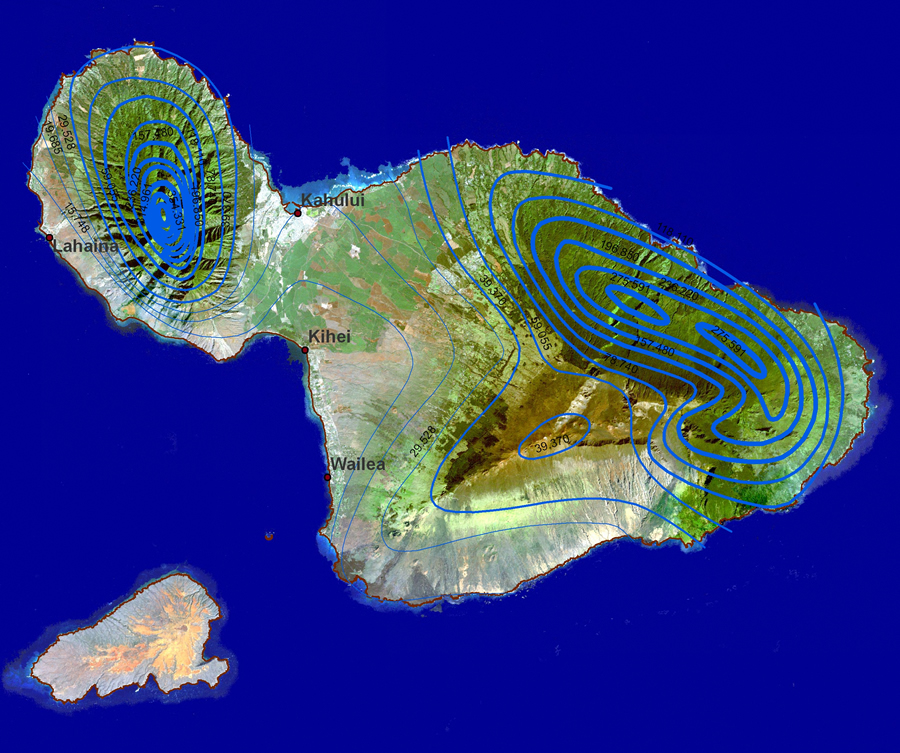
Isoline Map:
This map of rainfall isolines atop a Landsat image of Maui, Hawaii, illustrates why educators teach with GIS: Students can readily uncover relationships and patterns from processes operating on our world—from local to global scales. An isoline map is a map with continuous lines joining points of the same value. Examples would be equal altitude (contour lines), temperature (isotherms), barometric pressure (isobars), wind speed (isotachs), wind direction (isogon), wind shear (isoshear), etc. Isoline mapping is used to interpret the information on some thematic maps.
No comments:
Post a Comment